


Your agency signed more clients this year. Revenue went up. So why does the bank balance feel the same? For most agency owners, the answer sits inside individual clients and projects. A few accounts quietly consume more hours than they pay for, scope creep eats the margin on fixed-fee work, and nobody notices until the project closes.
This guide explains agency client and project profitability in practical terms: how to calculate it, which metrics to track, what a good profit margin looks like, what makes work unprofitable, and how to monitor margin while a project is still in progress, not after it is too late to act.
What agency profitability means at three levels
Agency profitability is not one number. To manage it, look at three levels that roll up into each other:
- Project profitability: the profit a single project generates after its delivery costs. This is where most margin is won or lost.
- Client profitability: the combined profit across every project, retainer and change request for one client. A client can look valuable on revenue and still be unprofitable.
- Agency profitability: the profit of the whole agency business after delivery costs and overhead cost (rent, software, leadership, sales and admin salaries).
Two terms come up constantly. Gross profit (often called delivery profit or project margin at the project level) is revenue minus the direct cost of delivering the work. Net profit is what remains after overhead, tax and every other expense. Agencies also use agency gross income (AGI): total revenue minus pass-through costs such as media spend, printing or freelancer fees you resell. AGI is the fairer base for margin analysis because pass-through costs inflate revenue without adding margin.
How to calculate project profitability and profit margin
The core formula is simple. The hard part is getting accurate inputs.
Project profit = Project revenue − Project costs
Project profit margin (%) = (Project profit ÷ Project revenue) × 100
Project costs include:
- Labor cost: hours logged by each team member multiplied by their cost rate (salary plus benefits and taxes, divided by available working hours).
- Project expenses: freelancers, subcontractors, stock assets, software bought for the project, travel.
- Pass-through costs: media or third-party spend you bill back. Remove these from both revenue and cost if you measure margin on gross income.
A worked example
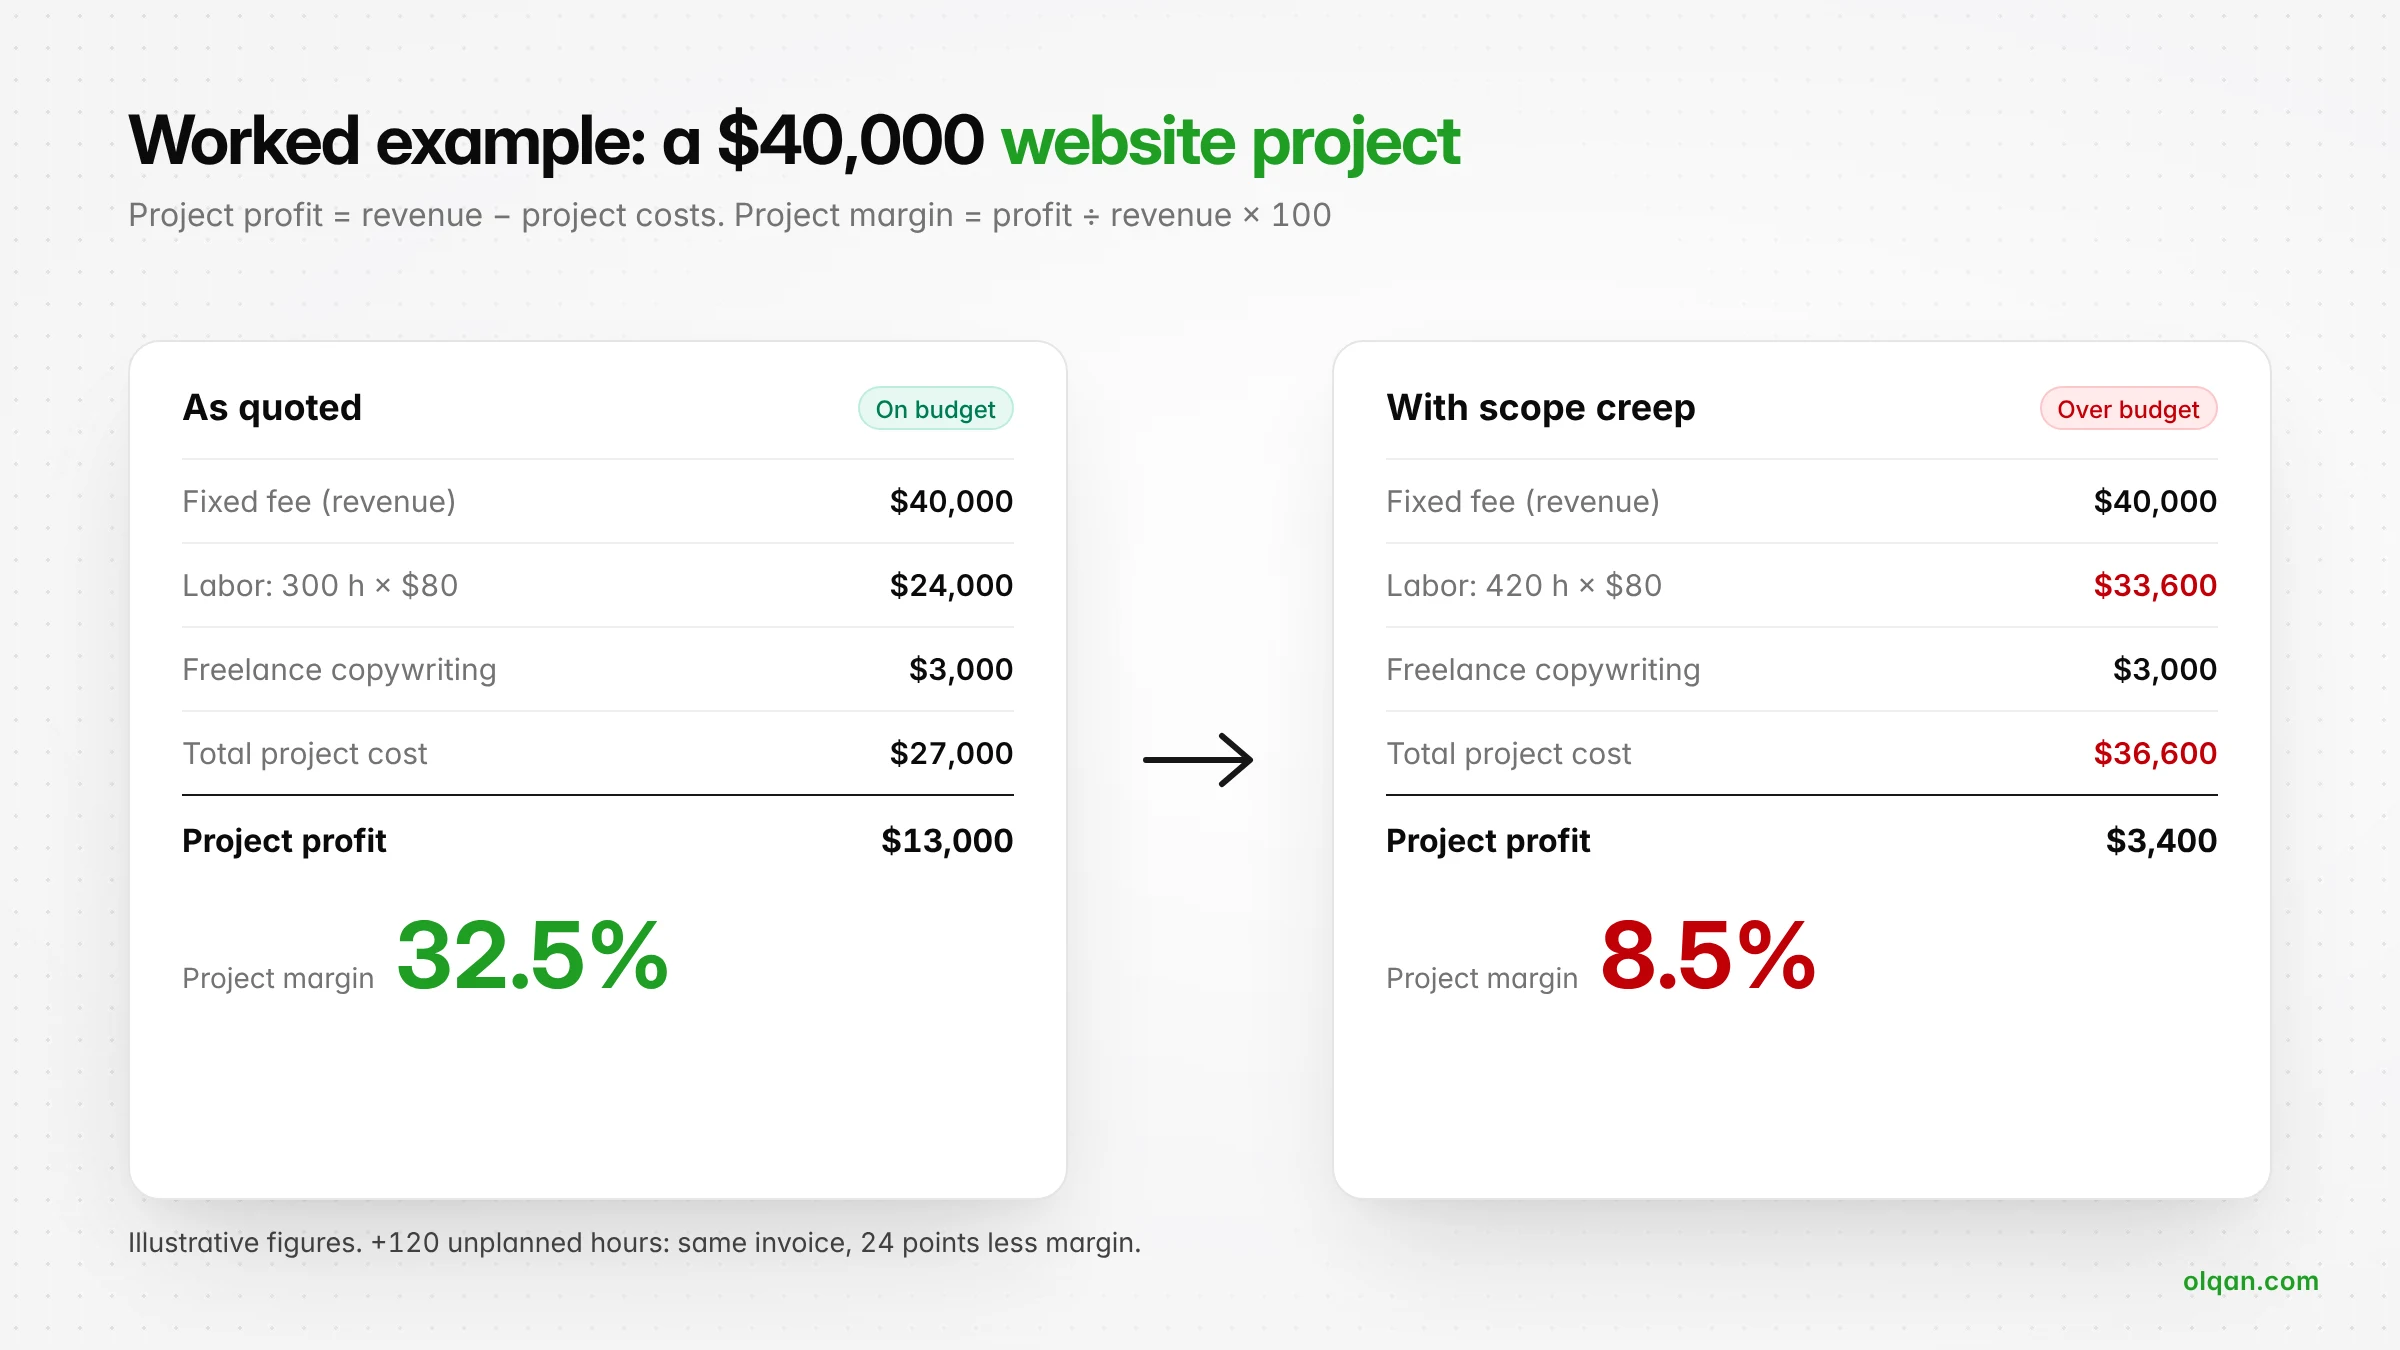
Worked example (illustrative figures): an agency sells a website redesign for a fixed fee of $40,000. The plan allows 300 hours at an average cost rate of $80 per hour, and the project uses $3,000 of freelance copywriting.
- Labor cost: 300 × $80 = $24,000
- Total project cost: $24,000 + $3,000 = $27,000
- Project profit: $40,000 − $27,000 = $13,000
- Project margin: $13,000 ÷ $40,000 = 32.5%
Now assume scope creep adds 120 unplanned hours. Labor cost rises to $33,600, total cost to $36,600, and the margin falls to 8.5%. Nothing about the invoice changed. Only the hours did. That is why time tracking is the foundation of every profitability metric.
Cost rate vs billing rate
Your cost rate is what an hour of a person’s time costs the agency. Your billing rate is what you charge the client for that hour. The gap between them is your margin per hour. A related metric is the effective hourly rate: project revenue divided by total hours actually worked. If you quote $150 per hour but your effective rate on a fixed-fee project falls to $95, you have found a pricing or scope problem.
How to calculate client profitability
Client profitability adds up every project, retainer and one-off request for a client over a period, usually a quarter or a year.
Client profit = Total client revenue − Total delivery costs for that client
Include the hidden costs: account management time, extra revision rounds, meetings and reporting. These hours are often logged as non-billable and never reach the project budget, which is exactly why some clients look profitable on paper and are not. Divide client profit by client revenue to get a client margin you can compare across your portfolio. Ranking clients by margin, not revenue, usually changes who you consider your best clients.

The metrics agencies should track
You do not need fifty KPIs. These metrics give agency leaders a clear view of financial health:
| Metric | Formula | What it tells you |
|---|---|---|
| Delivery margin | (Gross income − delivery costs) ÷ gross income | Whether your client work is priced and run profitably |
| Project margin | Project profit ÷ project revenue | Which project type earns the most |
| Client profitability | Client profit ÷ client revenue | Which client relationships are worth growing |
| Utilization rate | Billable hours ÷ available hours | How much team capacity turns into revenue |
| Budget vs actual | Actual hours or cost ÷ budgeted hours or cost | Whether a single project is on track while it is running |
| Effective hourly rate | Revenue ÷ total hours worked | The real price you earn per hour |
| Realization rate | Hours billed ÷ billable hours logged | How much billable work you actually invoice |
| Net profit margin | Net income ÷ gross income | Long-term profitability of the agency as a whole |
What is a good utilization rate?
There is no single benchmark, because a utilization rate depends on role. Designers, developers and strategists who do mostly client work can sustain a high share of billable hours, while a project manager, account lead or founder will be lower because part of their job is non-billable by design. Set targets per role, then watch the trend. A rate that keeps rising past a sustainable level usually means burnout and slipping quality, not efficiency.
What is a good profit margin for an agency?
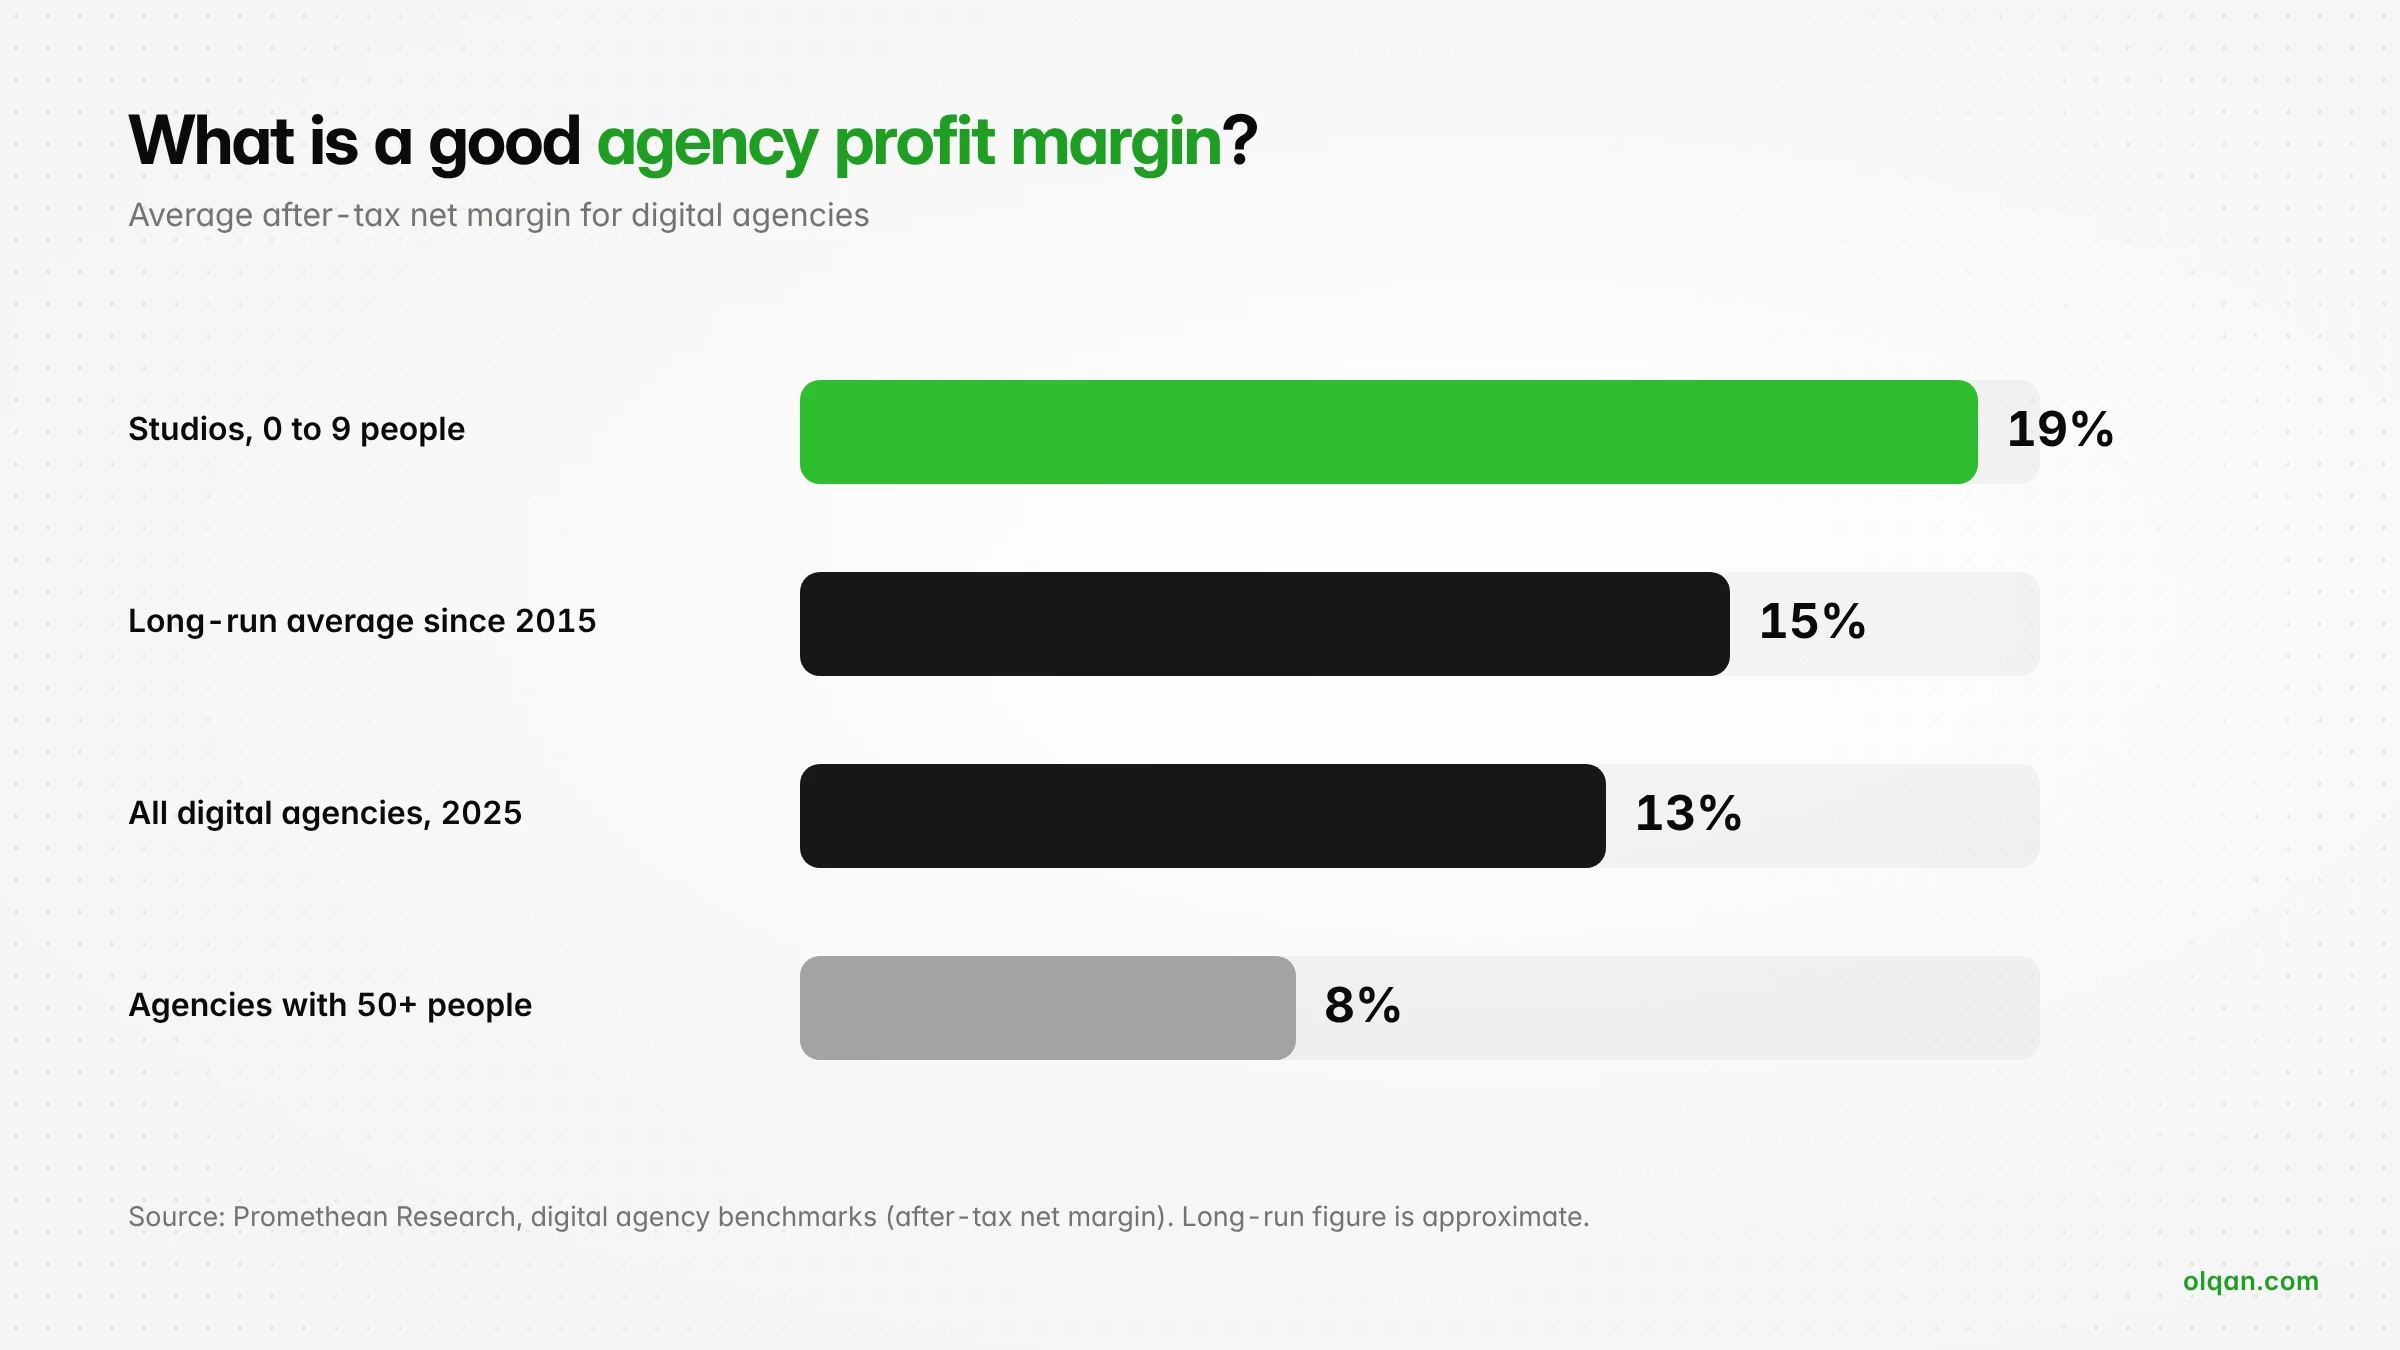
Benchmarks help you judge whether your margin is a problem. According to Promethean Research, digital agencies have averaged roughly a 15% after-tax net margin over the long run, and its 2026 survey put the 2025 average at 13%. Smaller studios reported higher margins (around 19%), while agencies with 50 or more staff reported around 8%.
For delivery margin, many agency finance advisors treat 50% or more as a healthy target, since overhead cost and profit both have to come out of what remains. If your delivery margin sits well below that, the fix is usually in pricing, scope control or utilization, not in cutting overhead. By that standard, the 32.5% project in the worked example above was underpriced before any scope creep started.
Use benchmarks as a reference, not a target. The best benchmark is your own trend: is project margin improving quarter by quarter, and do you know why?
What makes agency projects and clients unprofitable
Profitability issues rarely come from one big mistake. They come from small leaks repeated across many projects:
- Scope creep: extra requests absorbed without a change order. Each one feels too small to bill.
- Underpricing: quotes based on hope rather than on actual hours from similar past projects.
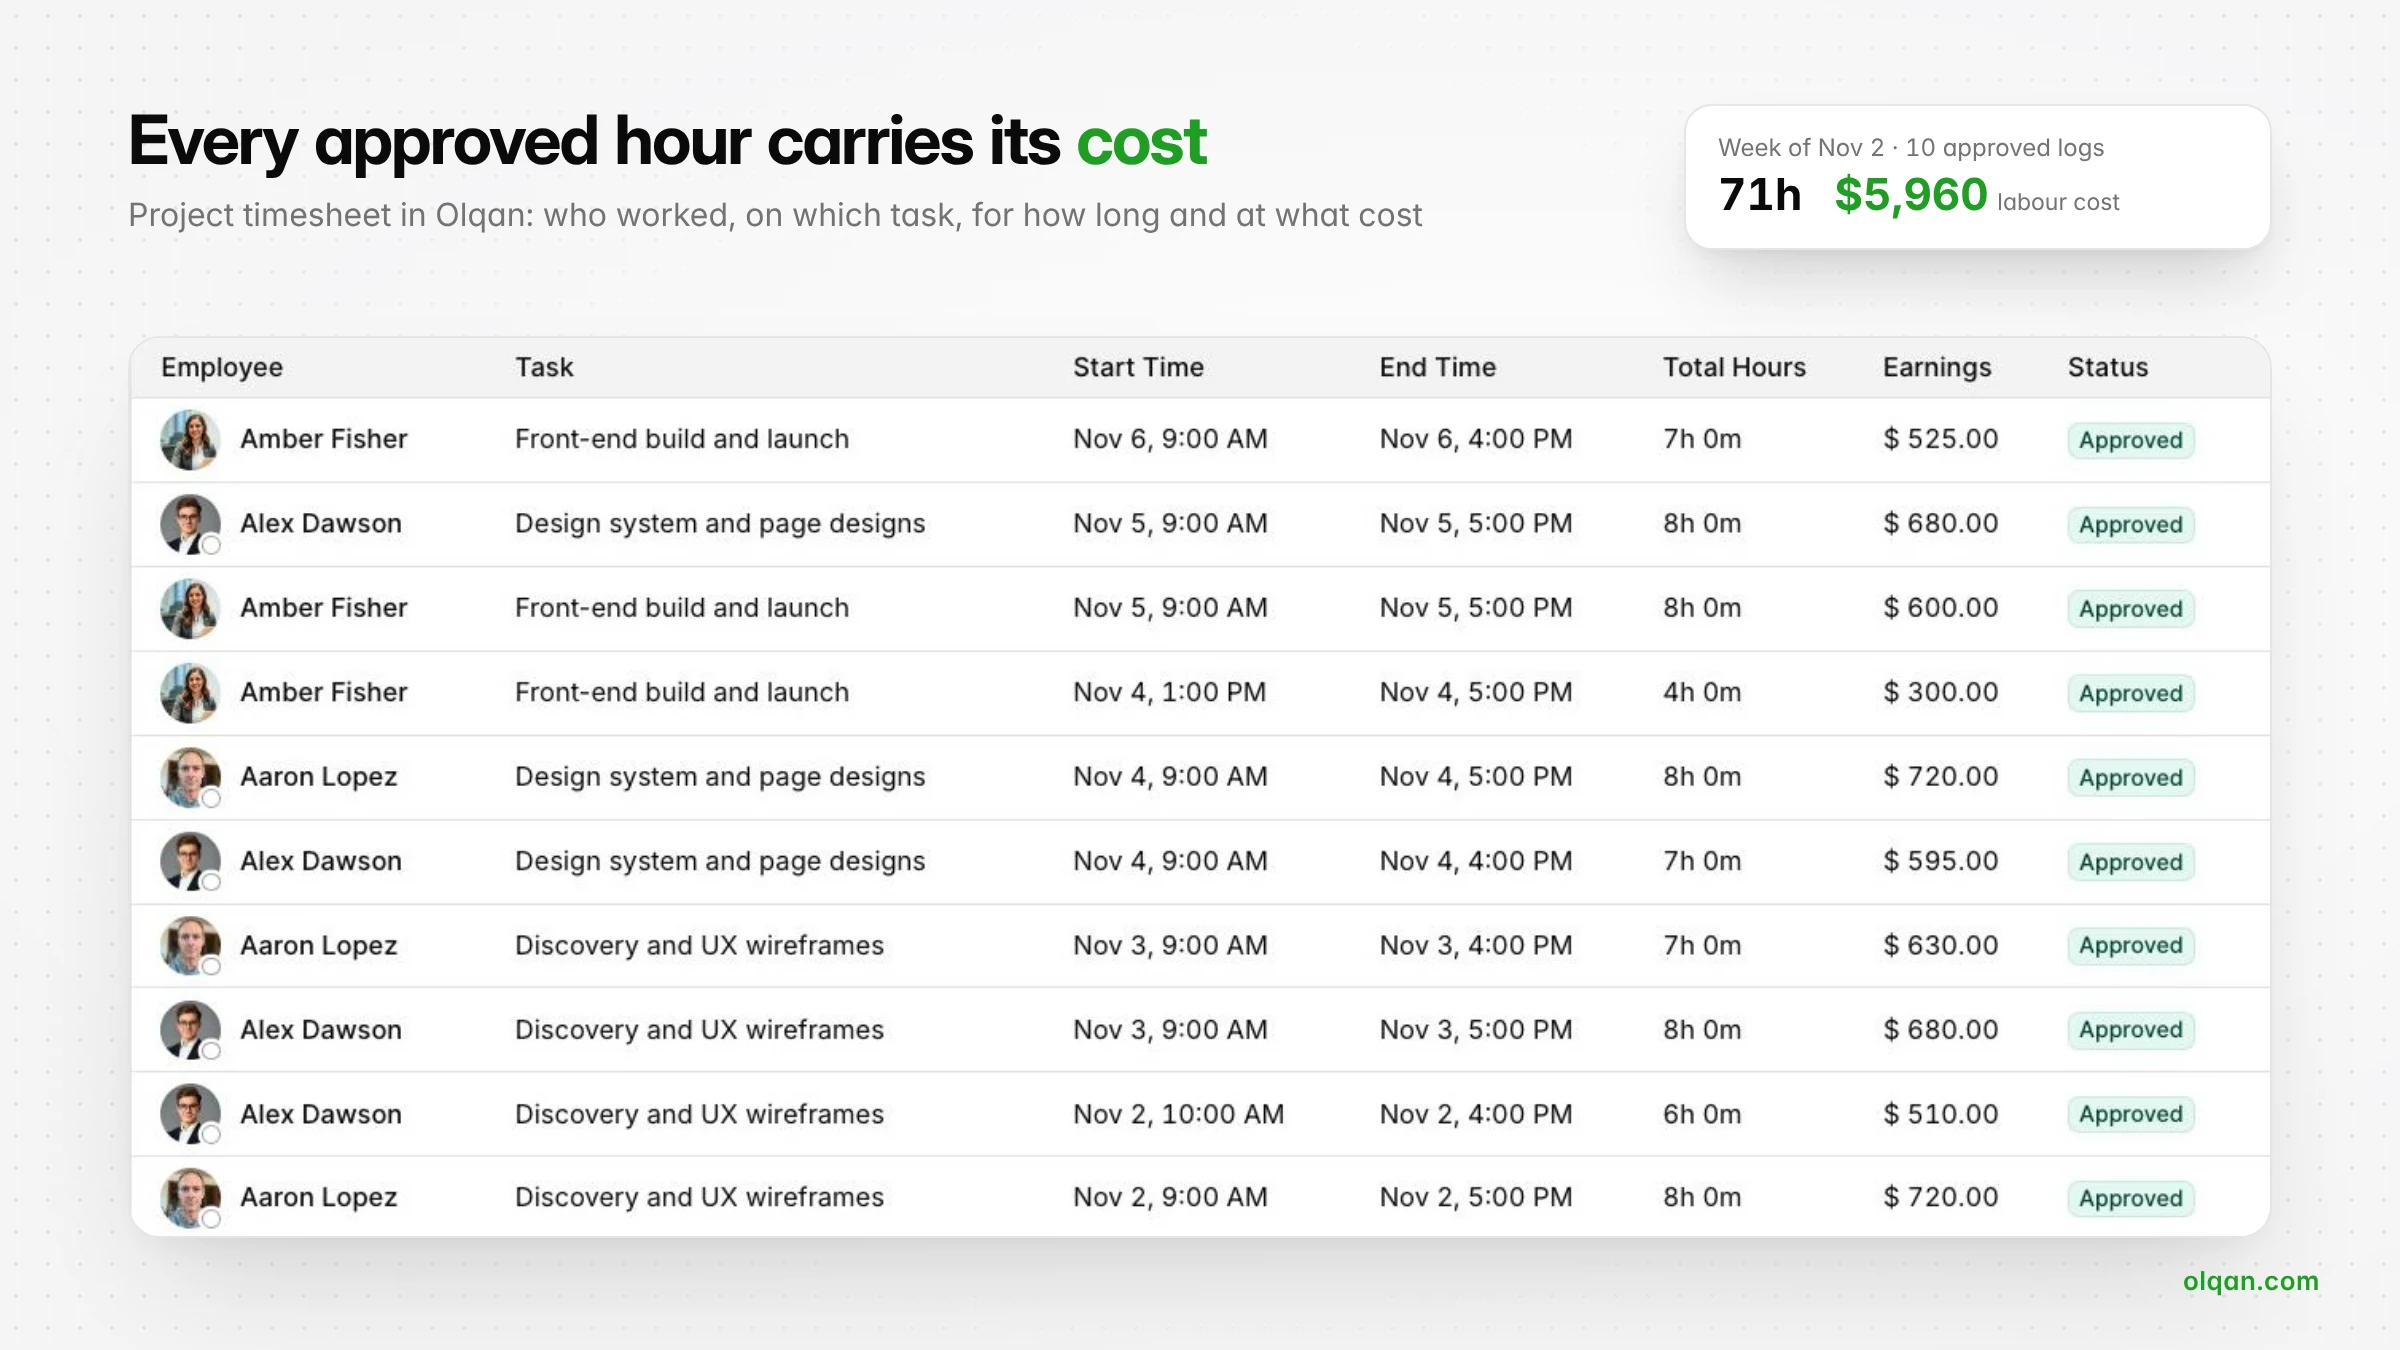
- Poor time tracking: if hours are logged late or not at all, you cannot see cost, so every margin figure is a guess.
- Unbilled work: billable hours that never make it onto an invoice. Low realization is lost revenue you already paid for.
- Over-servicing: extra revisions, meetings and reports a client never asked for, often to protect the client relationship.
- Poor project management: unclear briefs, late approvals and rework push hours up and delivery dates out.
- Slow invoicing and late payment: profit on paper does not help cash flow if invoices go out weeks after milestones.
- Disconnected tools: when time sits in one tool, budgets in a spreadsheet and invoices in accounting software, nobody sees project profitability data in one place.
How to monitor profitability while projects are in progress
Most agencies only calculate profit after a project closes. At that point the information is useful for future profitability, but it cannot save the current project. In-flight project profitability means checking margin while there is still time to act.
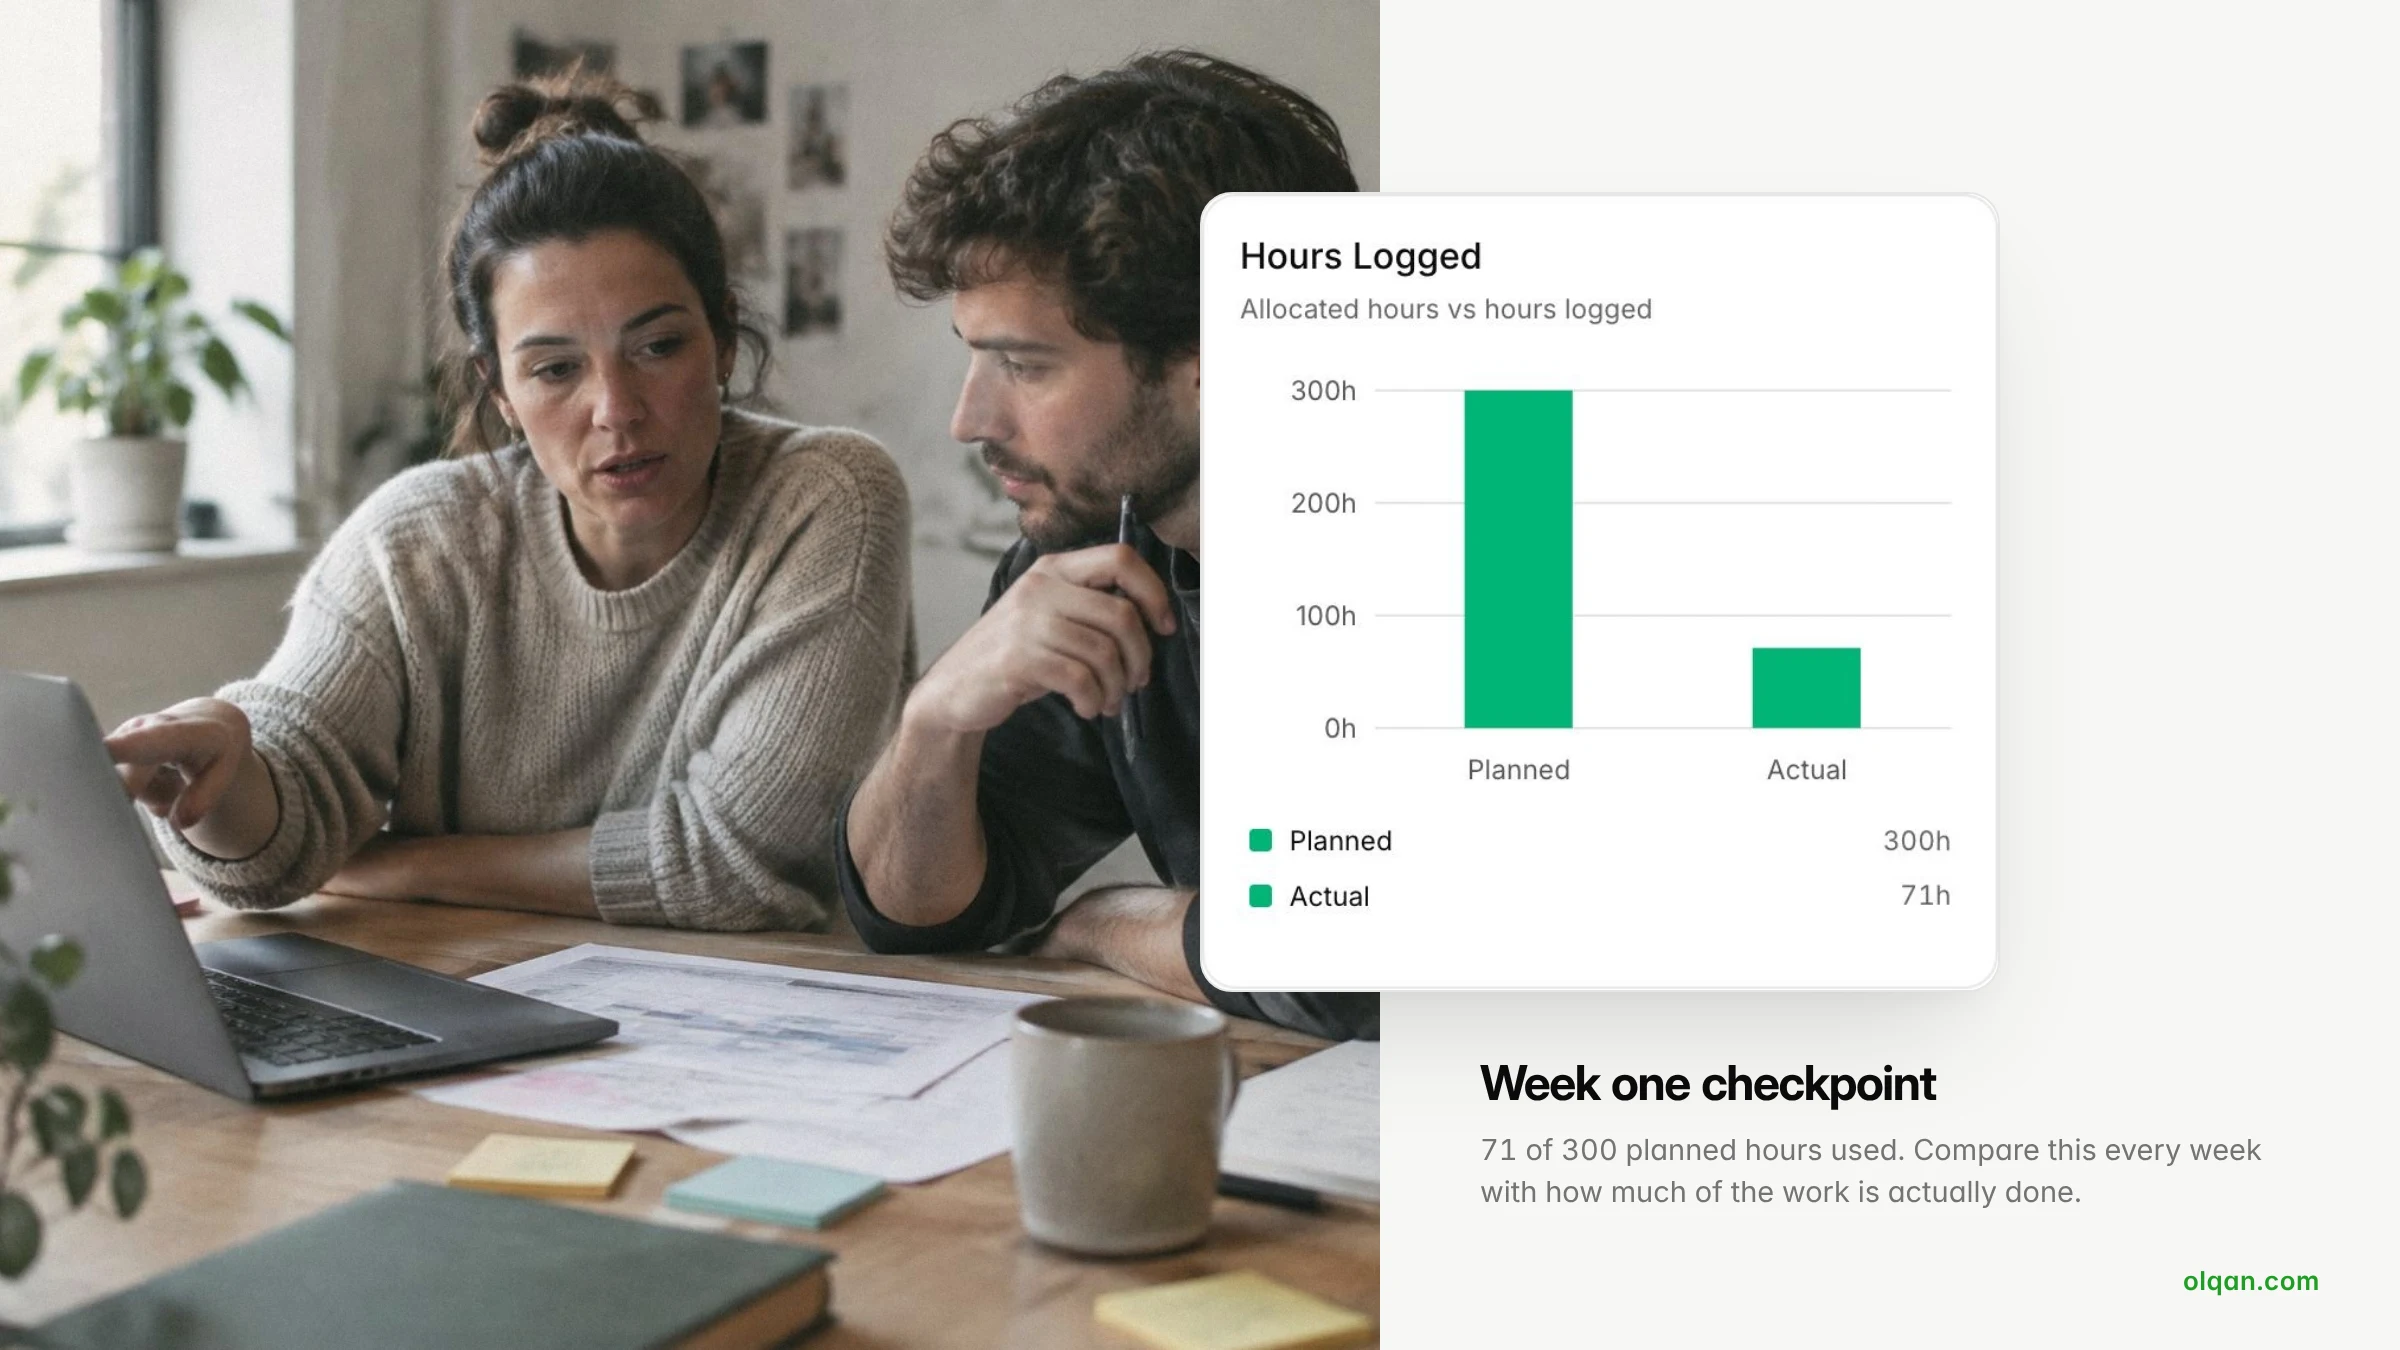
- Set a project budget in hours and cost before work starts. Break it down by phase or milestone so you can compare planned versus actual at each stage.
- Track time daily against tasks and phases. Weekly time entry is too late and too inaccurate.
- Review budget vs actual every week. If a project has used 70% of its budget at 50% completion, you have an early warning, not a surprise.
- Agree on triggers. For example, at 80% budget consumed the project manager reviews remaining scope with the client.
- Raise change orders immediately. Price out-of-scope requests while the client still remembers asking for them.
- Invoice at milestones. Billing as you go protects cash flow and makes scope discussions easier.
The question to answer every week is simple: are we on track to hit the target margin on this project, and if not, what will we change?
How pricing, scope and utilization affect project profitability
Three levers drive almost all agency profit: what you charge, how much work you do for that price, and how much of your team’s time turns into billable work.
Pricing models compared
- Hourly billing: low risk for the agency because every billable hour is paid, but it caps revenue at your capacity and rewards slow work.
- Fixed fee: clients like predictable pricing, and you keep the upside if you deliver efficiently. You also carry the risk of scope creep, so fixed-fee work needs tight scope and good data from past projects.
- Retainers: recurring revenue makes planning easier, but retainers drift. Track hours used against the retainer every month so it does not become unlimited work for a fixed price.
- Value-based pricing: price is tied to the outcome for the client rather than your hours. It can produce the highest margins, but it requires a clear understanding of client value and a confident sales process.
Moving from hourly billing to value-based pricing works best in steps: first learn your real delivery costs for each project type, then package repeatable work into fixed-fee offers, then price premium work on value once you have proof of results.
Scope and utilization
Scope defines how many hours a price must cover. Utilization defines how many hours your team can sell. A project with good pricing and poor scope control still loses money, and a team with low utilization makes every project carry more overhead. Improve profitability by working on all three together.
Plan resources and budgets to protect project margins
Margin is often lost at the planning stage. Before you confirm a project, check whether the right people are available. Staffing a project with whoever is free, rather than whoever fits, increases hours and rework. Good resource planning means:
- Building estimates from actual hours on similar past projects, not from memory.
- Checking team capacity across all active client work before committing to delivery dates.
- Assigning a budget owner, usually the project manager, who is responsible for margin, not only for deadlines.
- Keeping a buffer in fixed-fee quotes for revisions and coordination, which are real costs.
How project profitability relates to client relationships and retention
Client retention is one of the strongest profitability drivers because client acquisition is expensive and the first project with a new client is usually the least efficient. Long-term clients mean better estimates, fewer surprises and lower sales cost.
But retention only helps if the account is profitable. Use client profitability data in account reviews:
- Is this account consistently using more delivery hours than it pays for?
- Is margin on this client declining to the point where pricing needs to change at renewal?
- Which services for this client earn the best margin, and can we grow those?
Sharing the numbers internally changes conversations. An account lead who can see that a client runs at 15% margin will approach scope and pricing very differently from one who only sees revenue.
Software and reporting tools for tracking project profitability
Many agencies start with spreadsheets. They work until you have more than a handful of active projects. Then hours, rates, expenses and invoices drift apart, reports take days to build, and profitability reporting becomes a monthly exercise instead of a weekly habit.
When you evaluate project management software or profitability tracking tools (our guide on how to choose agency management software covers the full process), ask:
- Does time tracking connect directly to cost, without manual exports?
- Can you see in-flight project margin, not only final profitability at close?
- Can you view profitability by project, by client and by team member?
- Does it compare planned versus actual budget at each milestone?
- Can you invoice directly from project time, milestones and retainers?
- Does it show utilization and capacity so you can plan resources?
How Olqan helps agencies track profitability
Olqan is a business operating system that helps growing service businesses, including agencies and consulting firms, grow profitably. For project-level profitability, agencies use Olqan to:
- Track billable and non-billable time against each project.
- Set project budgets and see budget versus actual and project profitability as work happens.
- View team utilization and capacity before committing to new work.
- Invoice from project time, milestones and retainers, then track payments, send reminders and reconcile.
- Let clients approve, sign and pay through the Client Portal, so approvals and payments do not stall delivery.
Because sales, projects and finance live in one system, the data that drives profitability visibility stays connected from the first quote to the final payment. Olqan offers a free Solo plan, and paid plans include a 14-day trial with no credit card required. If you prefer a walkthrough, book a demo and we will start with your workflow.
How to improve agency project and client profitability: a checklist
- Measure margin on gross income, not on total revenue.
- Calculate a cost rate for every team member and keep it current.
- Make daily time tracking a non-negotiable habit.
- Set budgets per project and per milestone, and review budget vs actual weekly.
- Write clear scope documents and raise change orders for every out-of-scope request.
- Rank clients by margin and review the bottom 20% for repricing or exit.
- Analyze which project type and service line earns the best margin, then sell more of it.
- Invoice at milestones and follow up on late payments quickly.
- Replace disconnected spreadsheets with one system that links time, budgets and invoices.
Frequently asked questions
What is the difference between project profitability and project margin?
Project profitability is the absolute profit a project earns (revenue minus costs). Project margin is that profit expressed as a percentage of revenue, which lets you compare projects of different sizes.
Are digital marketing agencies profitable?
Yes, on average. Promethean Research reports a long-run average net margin of roughly 15% for digital agencies, with wide variation by size and specialization. Specialized agencies with strong pricing and tight delivery tend to beat the average.
How often should agencies review profitability?
Review project budget vs actual weekly, client profitability monthly or quarterly, and agency profit and loss monthly. Weekly reviews catch problems while projects are still in progress.
How does time tracking improve profitability?
Time tracking shows where hours actually go. Without it you cannot calculate delivery costs, spot scope creep, measure utilization or bill all billable hours, so every profitability analysis rests on guesses.
Conclusion
Profitable agencies are not the ones with the most clients. They are the ones that know, project by project and client by client, where they make money and where they lose it. Start with accurate time tracking, set budgets before work begins, watch budget vs actual every week, and price future work from real data. Do that consistently and agency profitability stops being a year-end surprise and becomes something you manage.