

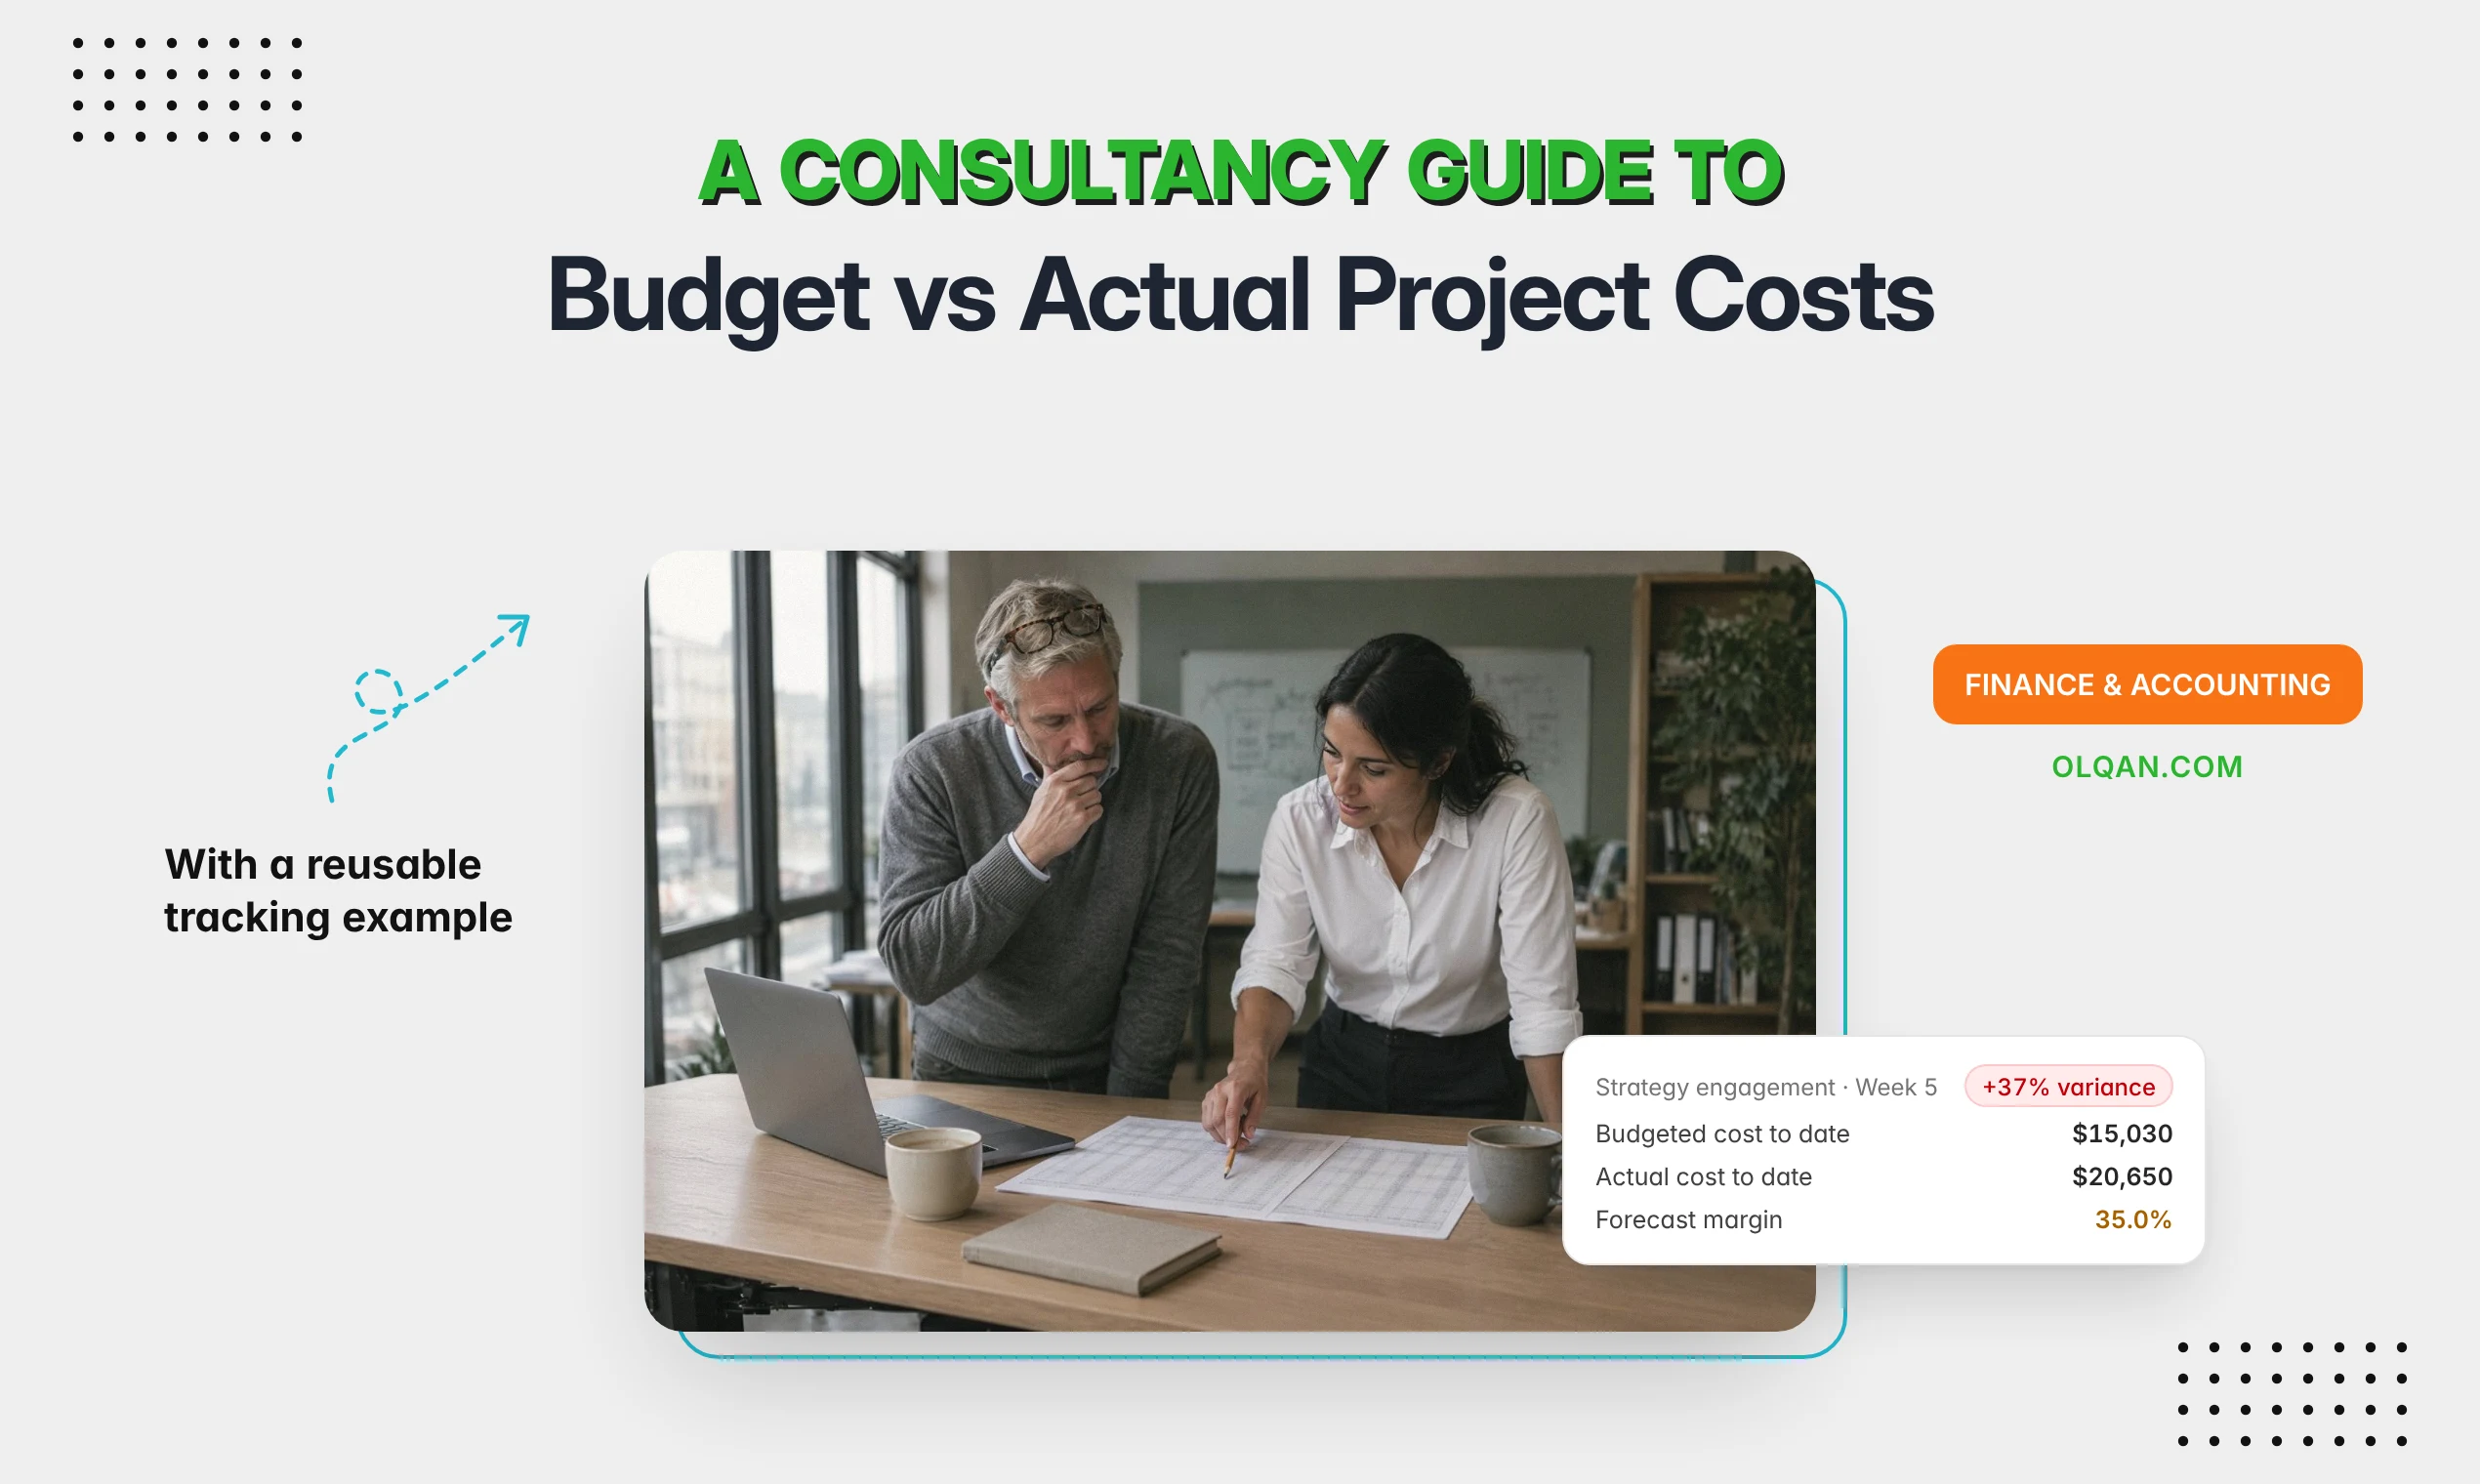
Budget vs actual project costs compares what you planned to spend on a project with what you have actually spent so far. For a consultancy, it is the earliest warning that an engagement is drifting: if you track it weekly, you can still fix the problem while the project is running instead of discovering it in the month-end financial reports. It is also the basis for an accurate forecast of where the project will finish.
This guide explains how budget vs actual analysis works for consulting projects, the formulas you need, a reusable tracking example you can copy into a spreadsheet, and the weekly routine that turns the numbers into decisions.
What is budget vs actual analysis?
Budget vs actual analysis (often shortened to BvA) is the comparison between budgeted figures and actual results for a project, department or period. The difference between the two is the variance, and studying it is called variance analysis. In project management, the process of comparing budget and actual figures answers three questions:
- Where are we? How much of the project budget has been spent, in hours and in money.
- Is that right for this stage? Whether spending is in line with the work completed.
- Where will we end up? A forecast of the final cost and margin if nothing changes.
A budget vs actual report is only useful if it is current. A comparison prepared once a month after the books close tells you what happened. A weekly comparison, ideally from real-time data, tells you what to do next.
Budget vs forecast vs actual
The three terms are related but answer different questions:
- Budget: the approved budget, set before the project starts. It is the financial plan you priced the work on and does not change unless the scope changes.
- Actuals: the costs you have actually incurred to date, based on approved time, expenses and supplier costs.
- Forecast: your current estimate of the final cost, based on actual performance so far plus the estimated costs to finish. Revise it every week.
Budget vs actual tells you how far you have drifted from plan. Budget and forecast together tell you where you will end up. A consultancy needs both to make informed decisions about staffing, scope and the client conversation.
Why budget vs actual matters for consultancies
In a consulting firm, the biggest project cost is almost always people’s time. That makes budget overruns easy to miss: there is no invoice from a supplier, just a few extra hours each week from senior people who want the work to be right. Common causes of cost variance in consulting projects:
- Partners or senior consultants doing work that was budgeted for analysts.
- Extra workshops, revisions or analysis requested by the client without a change request.
- Underestimated discovery or data collection at the start of the engagement.
- Non-billable time such as internal reviews and travel that never made it into the budget.
- Expenses and subcontractor costs recorded late, so the project looks healthier than it is.
On a fixed-fee engagement, every one of these comes straight out of your margin. On time and materials work, they can lead to invoices the client disputes. Either way, tracking budget vs actual project costs protects profitability, cash flow and the client relationship. Across many projects, it is also the clearest picture of the firm’s financial health.
What to include in a consulting project budget
You can only compare actuals with a budget that is built the same way. A practical project budget for a consultancy has two sides.
Cost side
- Labor costs: budgeted hours by role, multiplied by each role’s internal cost rate (salary and overheads per hour, not the billing rate).
- Expenses: travel, research, licences, printing and other direct costs.
- Subcontractors: specialists or freelancers you pay for the engagement.
- Contingency: a reserve for known risks, usually a small percentage of the total.
Revenue side
- The fee and pricing model: fixed fee, time and materials, or retainer.
- The billing schedule, so you can compare costs incurred with revenue invoiced.
- The target margin the engagement was priced for.
Break the budget down by role or phase, not just one total. A single number tells you that you are over budget. A budget by role tells you why.
Budget vs actual formulas
Five calculations, the key performance indicators of project cost control, cover almost every consulting project:
| Metric | Formula | What it tells you |
|---|---|---|
| Cost variance | Actual cost − budgeted cost to date | How far you are over or under plan in money |
| Variance % | Cost variance ÷ budgeted cost to date | The size of the variance relative to plan |
| Budget burn | Actual cost ÷ total budget | How much of the budget has been used |
| Budgeted cost to date | Total budget × % of work complete | What you should have spent for the work done |
| Estimate at completion (EAC) | Actual cost + estimated cost to finish | The forecast final cost of the project |
The key point is the comparison point. Comparing actual spend with the full budget is misleading halfway through a project. Compare it with what you should have spent for the work completed. That requires an honest estimate of percent complete, ideally based on deliverables finished rather than time elapsed.
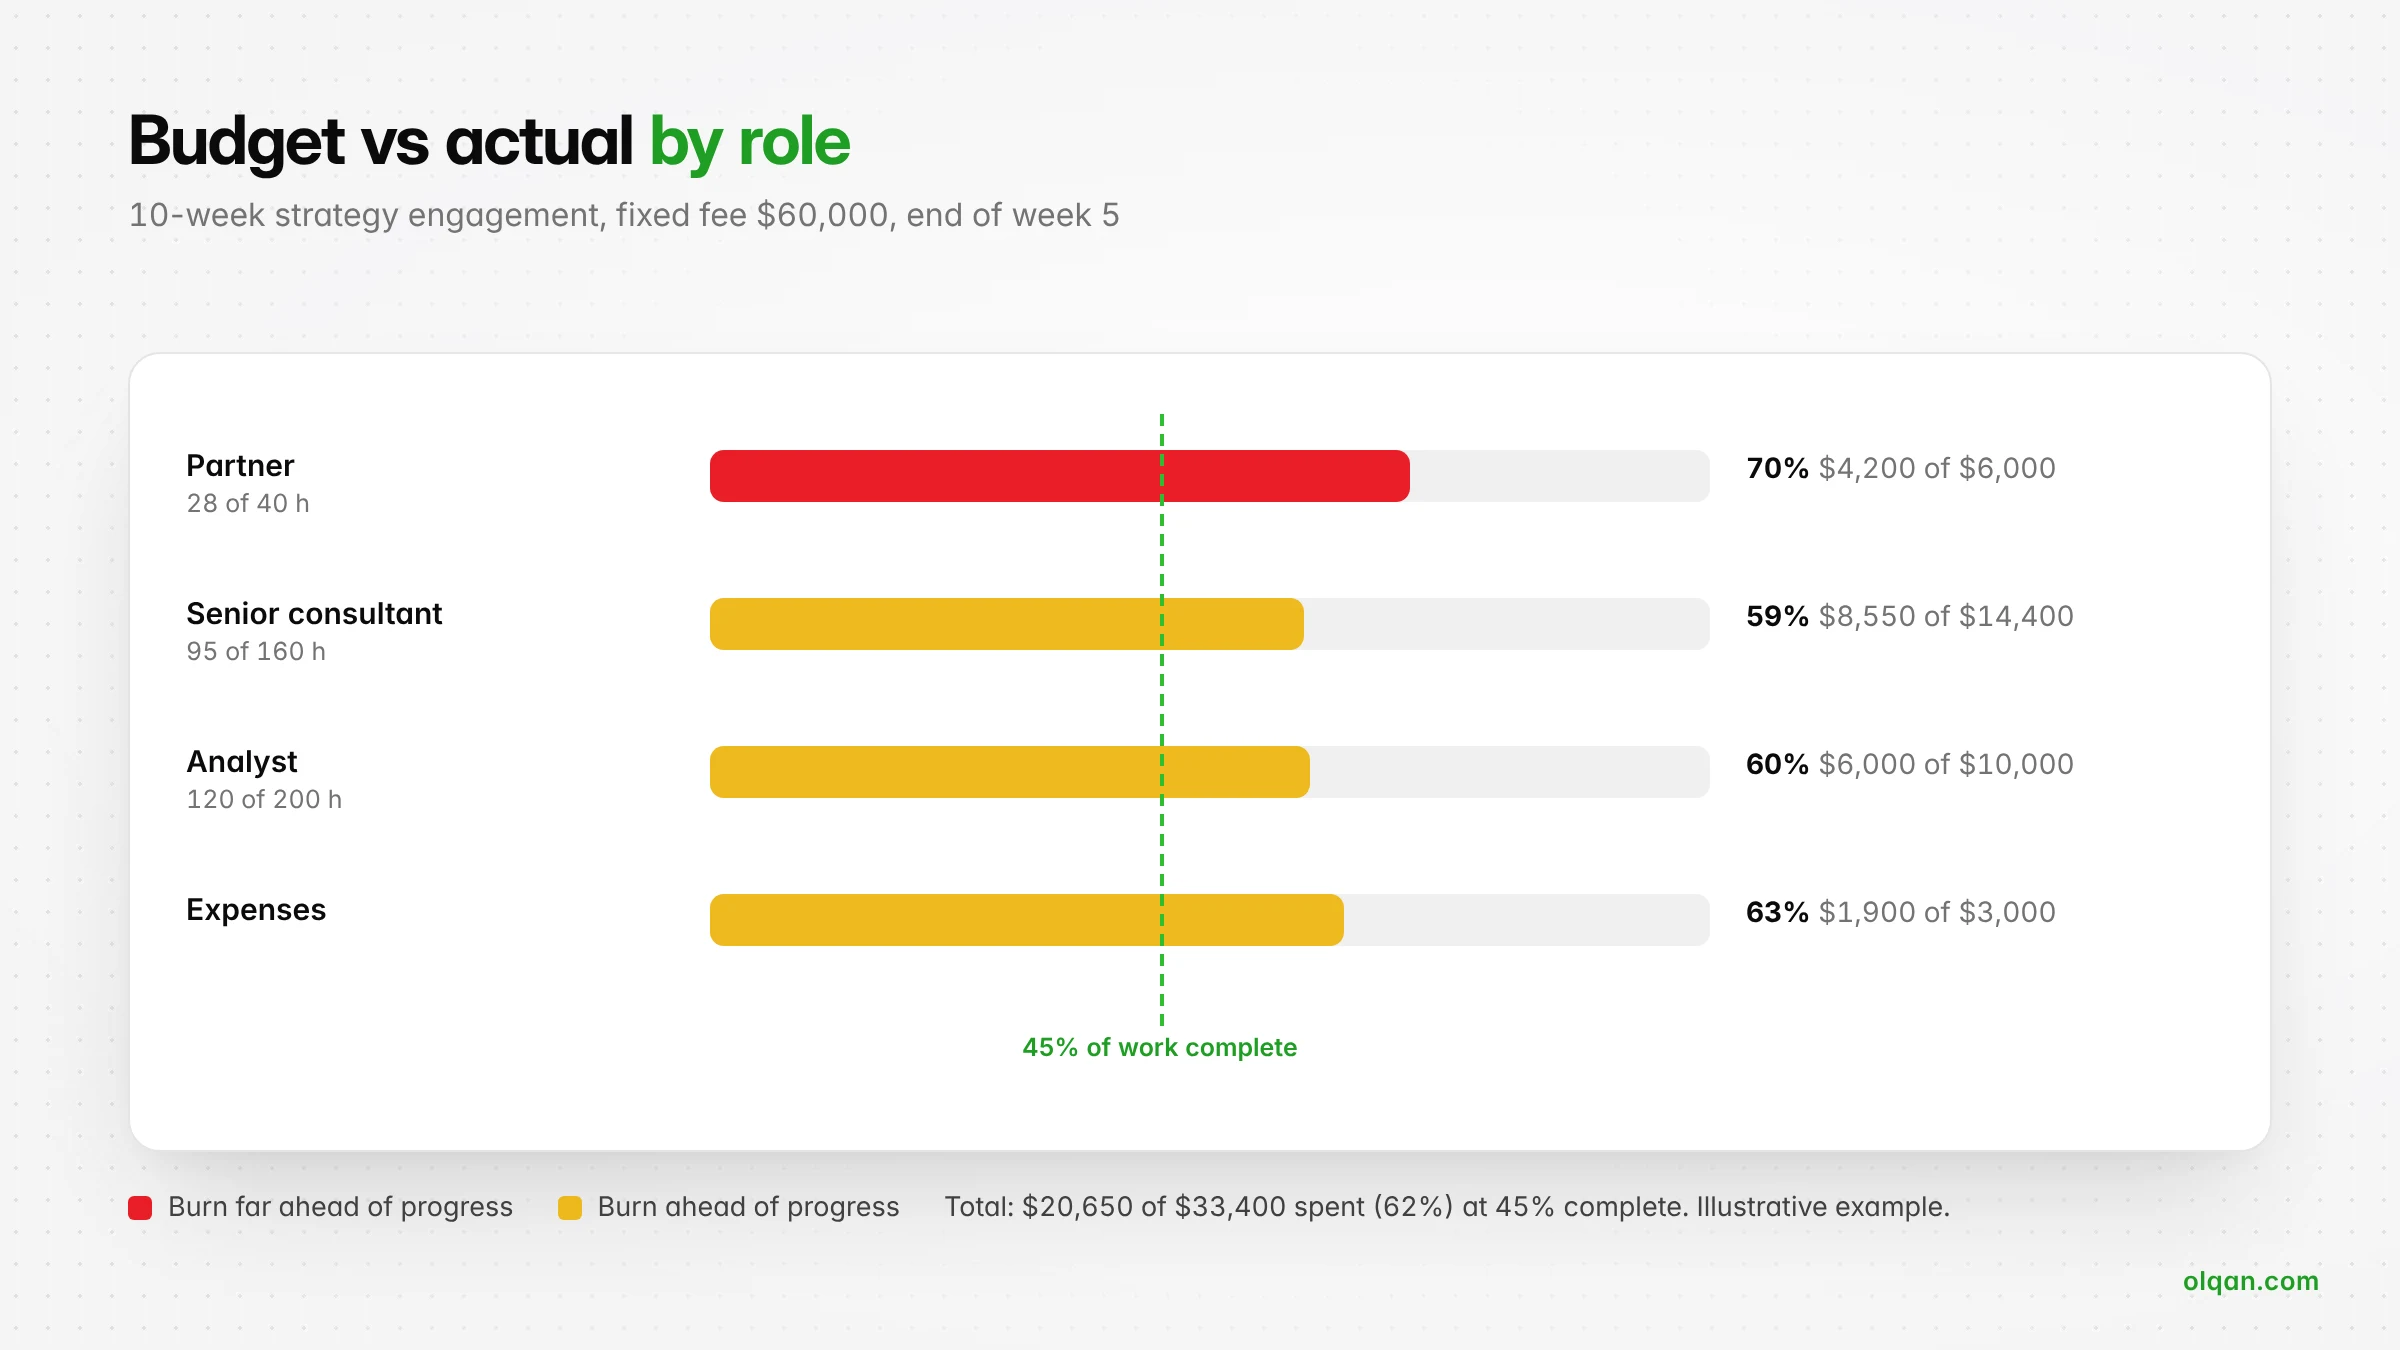
Worked example: tracking a 10-week strategy engagement
Here is a reusable tracking example (illustrative figures, not a real client). A consultancy sells a 10-week strategy engagement for a fixed fee of $60,000. The budget:
| Line | Budgeted hours | Cost rate | Budgeted cost |
|---|---|---|---|
| Partner | 40 | $150 | $6,000 |
| Senior consultant | 160 | $90 | $14,400 |
| Analyst | 200 | $50 | $10,000 |
| Expenses | n/a | n/a | $3,000 |
| Total | 400 | $33,400 |
Planned margin: $60,000 − $33,400 = $26,600, or 44.3%.
At the end of week 5, the project manager estimates the work is 45% complete. The budget vs actual comparison looks like this:
| Line | Budget | Actual to date | Budget burn |
|---|---|---|---|
| Partner | 40 h / $6,000 | 28 h / $4,200 | 70% |
| Senior consultant | 160 h / $14,400 | 95 h / $8,550 | 59% |
| Analyst | 200 h / $10,000 | 120 h / $6,000 | 60% |
| Expenses | $3,000 | $1,900 | 63% |
| Total | $33,400 | $20,650 | 62% |
Now apply the formulas:
- Budgeted cost to date: $33,400 × 45% = $15,030.
- Cost variance: $20,650 − $15,030 = $5,620 over plan, a 37% variance.
- Forecast if the remaining work goes to plan: $20,650 + $18,370 remaining budget = $39,020 final cost, a margin of $20,980 or 35.0%.
- Forecast if the current overrun continues: $20,650 ÷ 45% = $45,889 final cost, a margin of $14,111 or 23.5%.
The total says the project is in trouble. The breakdown says where: the partner has used 70% of their hours at 45% complete, and every role is ahead of the work. In this example, the actions are to move partner review to fixed checkpoints, protect the analyst hours for the remaining modelling, and check whether the extra workshops in weeks 3 and 4 were in scope. If they were not, it is time for a change request, not a quiet write-off.
Margin is the number that matters most at the end. For the full calculation of project and client margins, see our guide on how to calculate project profitability.
A budget vs actual template you can reuse
Set up one row per budget line (role, phase or expense type) with these columns, and update it every week:
| Column | What goes in it |
|---|---|
| Budget line | Role, phase or expense category |
| Budgeted hours | Hours sold or planned for this line |
| Cost rate | Internal cost per hour for the role |
| Budgeted cost | Budgeted hours × cost rate, or the expense budget |
| Actual hours to date | From approved timesheets |
| Actual cost to date | Actual hours × cost rate, plus recorded expenses |
| Budget burn % | Actual cost ÷ budgeted cost |
| Remaining estimate | The project manager’s estimate of cost to finish |
| Estimate at completion | Actual cost + remaining estimate |
| Variance at completion | Estimate at completion − budgeted cost |
| Comment | The reason for any variance and the action agreed |
Add a summary line for the whole project with percent complete, budgeted cost to date, cost variance and forecast margin. That one line is what leadership needs to see each week.
How to run a weekly budget vs actual review
- Close the week’s timesheets. Ask everyone to log time by Friday and approve it on Monday. Actuals are only as good as the time data behind them.
- Record expenses and subcontractor costs. Add costs when they are committed, not when the invoice arrives.
- Update percent complete. Base it on deliverables finished, not on weeks elapsed.
- Review variances by line. Flag any line where budget burn is more than 10 percentage points ahead of percent complete, and find the root cause of each deviation.
- Update the forecast. Revise the remaining estimate and the estimate at completion, and share forecast changes with the finance team.
- Agree actions. Re-plan staffing, raise a change request or talk to the client. Write down the decision next to the variance.
Keep the review to 15 minutes per project. The goal is decisions, not a longer report.

How to read a budget variance
- Timing variance: money spent earlier than planned, such as travel booked in advance. Not a real overrun, but note it.
- Efficiency variance: more hours than planned for the same work. The most common problem in consulting, and the one to act on quickly.
- Rate variance: the right hours, but done by more expensive people. Shows up when senior staff cover junior work.
- Scope variance: extra work the client asked for. Fixed with a change request, not with more hours.
- Favorable variance: spending below plan. Check that work is not simply late before you celebrate.
- Negative variance on revenue: actual revenue below plan, for example a milestone invoiced late. Track it next to costs, because cash flow suffers even when costs are on budget.
Budget vs actual for different pricing models
| Pricing model | What to track | Main risk |
|---|---|---|
| Fixed fee | Cost vs budget and forecast margin | Overruns reduce margin directly |
| Time and materials | Hours vs estimate and any cap agreed with the client | Exceeding the estimate without warning the client |
| Retainer | Hours used vs hours included each month | Over-servicing that becomes the new normal |
| Milestone billing | Cost to date vs milestones invoiced | Spending ahead of what you can bill |
Common mistakes in budget vs actual tracking
- Using billing rates instead of cost rates. Billing rates measure revenue. Budget vs actual costs needs what the time actually costs the firm.
- Tracking only total hours. Without a breakdown by role, you cannot see rate variances or who is over plan.
- Comparing actuals with the full budget. Always compare with budgeted cost to date, based on percent complete.
- Leaving out non-billable time. Internal reviews and travel are real costs. Track them against the project.
- Never updating the forecast. The original budget is a baseline. The estimate at completion is what you manage.
- Running the numbers in a separate spreadsheet. Copying timesheets into a workbook every week is slow and error-prone. It also means the numbers are always out of date.
Spreadsheet or project software?
A spreadsheet is a good way to start and the template above works in Excel or Google Sheets. It becomes a problem once you run more than a handful of projects at a time: someone has to export timesheets, update cost rates, add expenses and rebuild the report every week.
Project management software with budgets and time tracking does this automatically, because the budget, the time logs, the project expenses and the invoices are in the same system. Monitoring actual costs becomes a dashboard you check, not a report you build. If you are comparing tools, our guides to project management software with invoicing and professional services automation (PSA) software cover what to look for.
How Olqan tracks budget vs actual project costs
Olqan is a business operating system that helps growing service businesses, including consulting firms, grow profitably. Budget vs actual is built into how projects run:
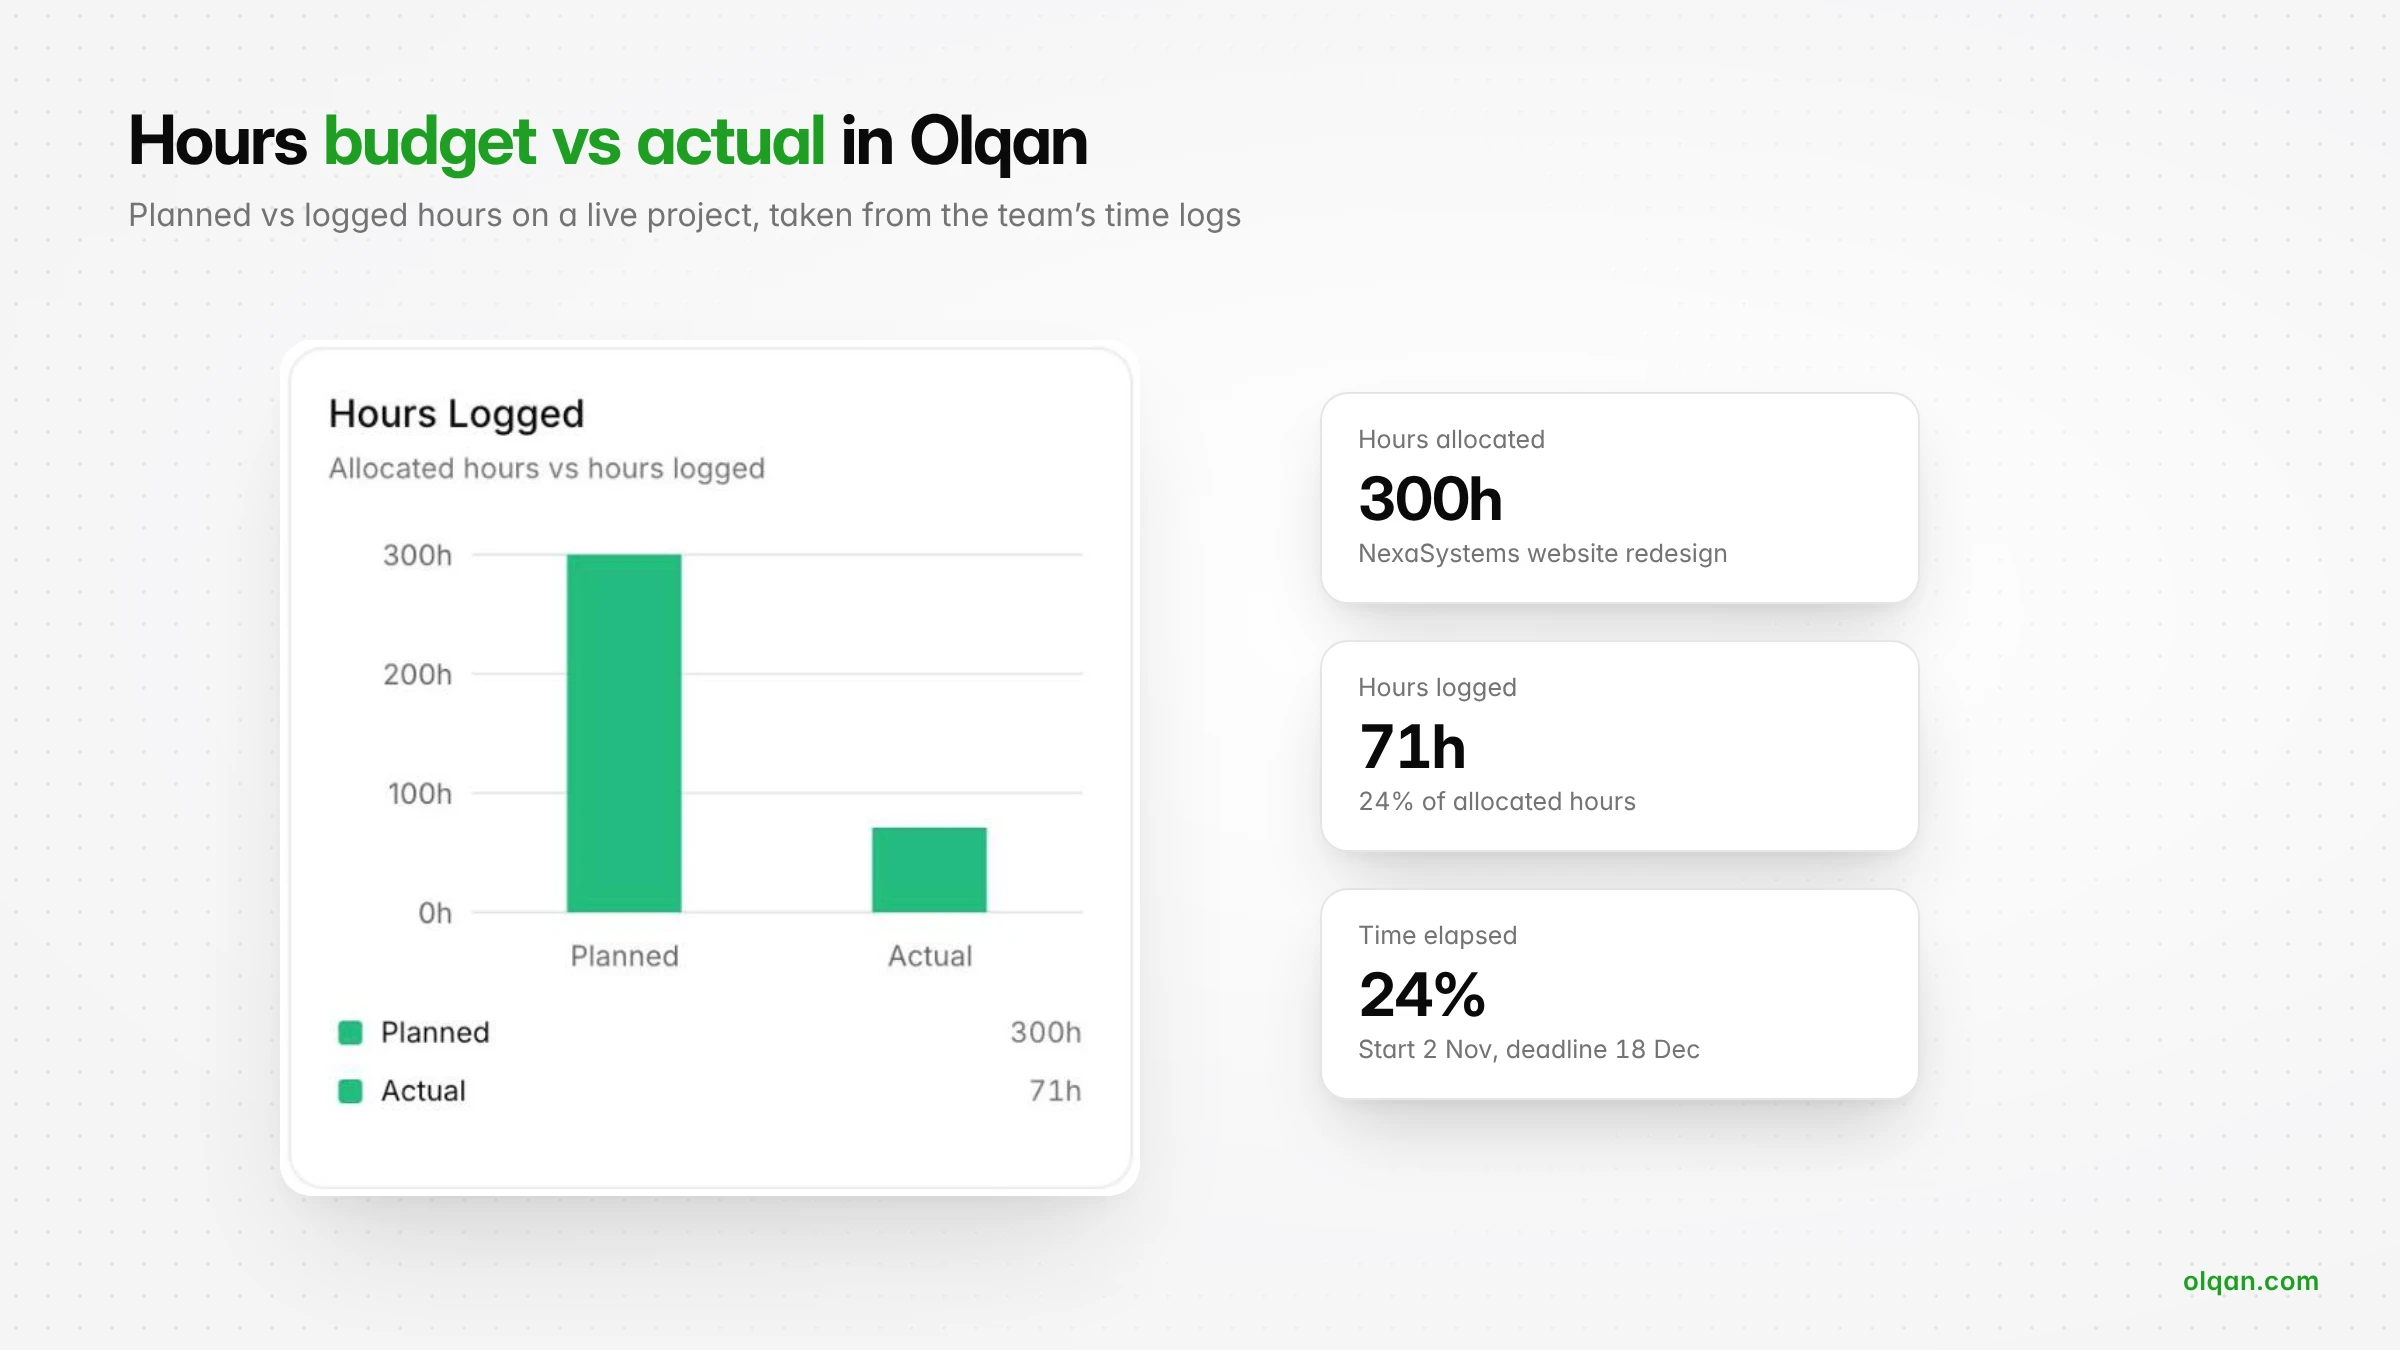
- Project budgets: set a budget for each project and see budget versus actual and project profitability while work is in progress.
- Timesheets: the team logs time against tasks, marked billable or non-billable, and approved time logs record what that time cost.
- Utilization and capacity: see who is over or under booked before it shows up as a budget overrun.
- Invoicing: bill from project time, milestones or retainers, so revenue and costs sit on the same project.
- Reports: ready-made project, time and finance reports, without rebuilding a spreadsheet every week.
Olqan offers a free Solo plan, and paid plans start at $12 per user per month billed yearly, with a 14-day trial and no credit card required (see pricing). To see budget vs actual on your own projects, book a demo.
FAQs
What is budget vs actual in project management?
It is the comparison between the planned cost of a project and the actual cost incurred so far, used to spot overruns early and forecast the final cost and margin.
How do you calculate budget vs actual variance?
Subtract the budgeted cost to date from the actual cost. Divide the result by the budgeted cost to date to get the variance as a percentage. A positive number means you are over budget.
How often should a consultancy review budget vs actual?
Weekly for active projects. Monthly reviews are too late on engagements of a few weeks or months, because most of the budget can be gone before the first report.
What is an acceptable budget variance?
Many firms set a threshold of around 10% before a variance needs action, but the right level depends on project size and margin. On a low-margin fixed-fee project, a smaller variance can already erase the profit.
Is budget vs actual the same as variance analysis?
Closely related. Budget vs actual is the comparison itself. Variance analysis goes one step further and explains why each budget variance happened and what to do about it.
Should budget vs actual use cost rates or billing rates?
Cost rates. Billing rates show the value of the work to the client. Cost rates show what the work costs your firm, which is what a cost budget measures.
Conclusion
Budget vs actual project costs is the simplest early warning system a consultancy has. Build the budget by role, compare actuals with budgeted cost to date rather than the total, update the forecast every week, and write down the action behind every variance. Do that consistently and overruns become a conversation in week 5, not a surprise at the end of the engagement.